APPLICATION IN MAXIMO APPLICATION SUITE
Monitor
Home > Maximo Application Suite > Monitor
Maximo Application Suite - Monitor
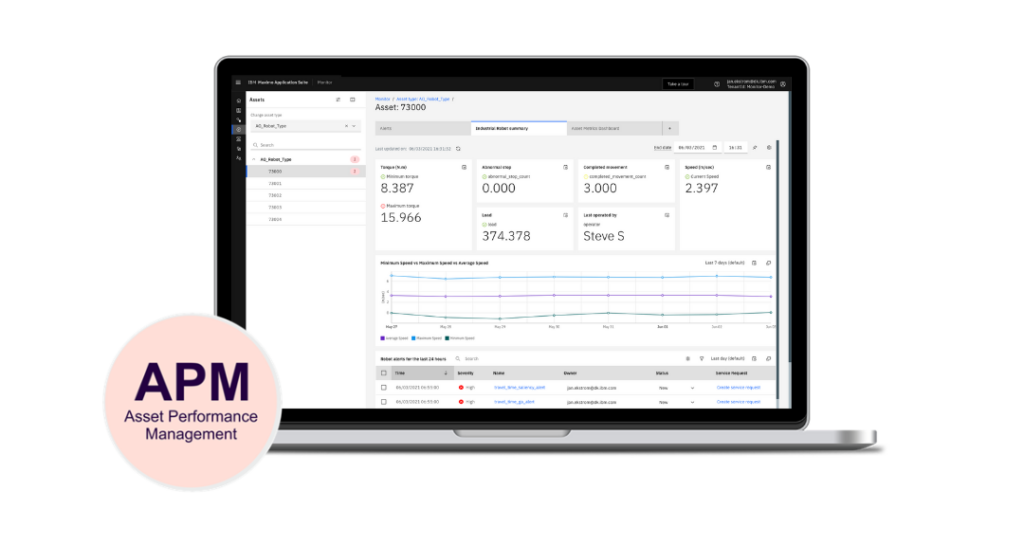
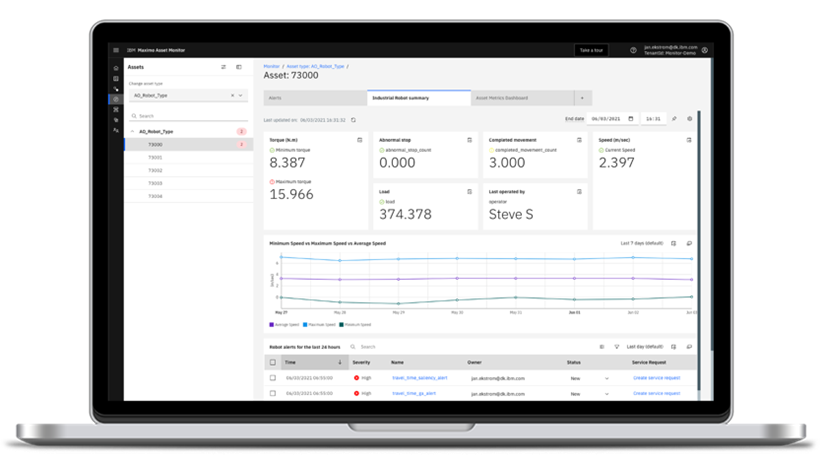
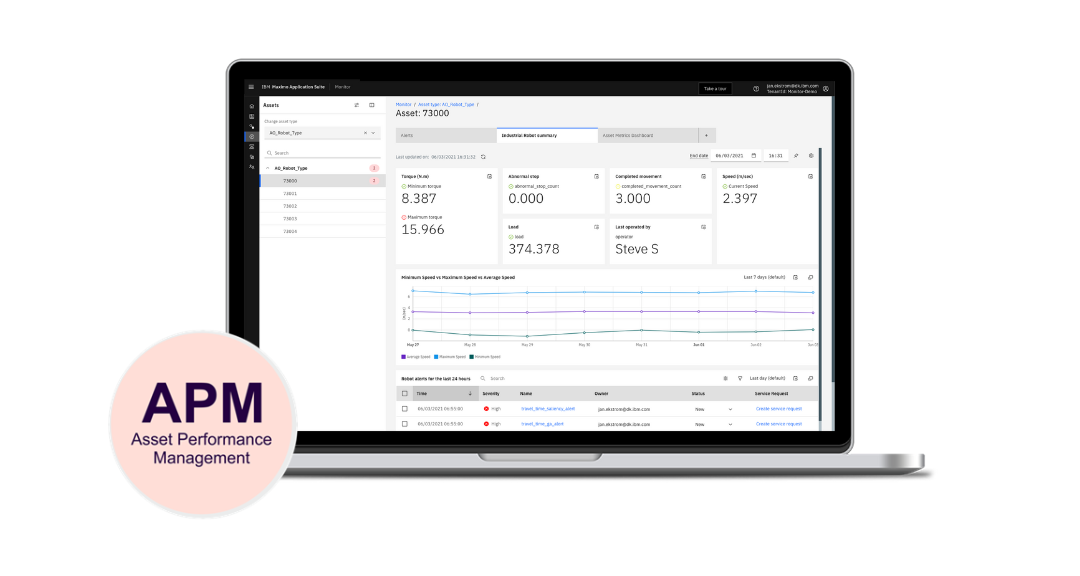
In combination with the Manage application Manage enables you to establish condition-based preventive maintenance using streaming IoT data from your increasingly intelligent components. Monitor also allows you to work visually with IoT data and forward it to other applications in the "Suite", such as Health and Predict.
Features

Gain Insights from Your Data in Real-Time with AI
With Maximo Monitor, you unlock value that was previously locked in your data. Visualize your data in real-time, identify trends over time, detect anomalies, and receive alerts when your assets require attention. All of this is accessible through dashboards tailored to your business needs. You can quickly get started with Maximo Monitor by connecting your data sources, configuring data analysis, and then visualizing the results in dashboards.
Connect Your Data Sources
In this step, you provide Maximo Monitor with the data sources you wish to analyze. Only your imagination sets the limit for the type of data that can be connected. Perhaps noise level is an important indication of a particular asset's health, and in that case, the corresponding sensor data is connected in this step. Pre-built connectors make it easy for you to configure data flows into Maximo Monitor. In this step, you also inform Maximo Monitor which data flow is associated with which asset in Maximo Manage.
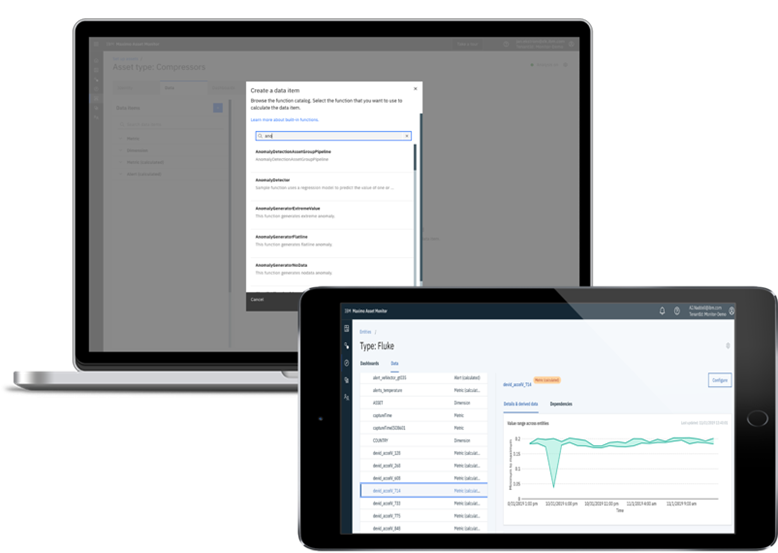
Configure Data Analysis
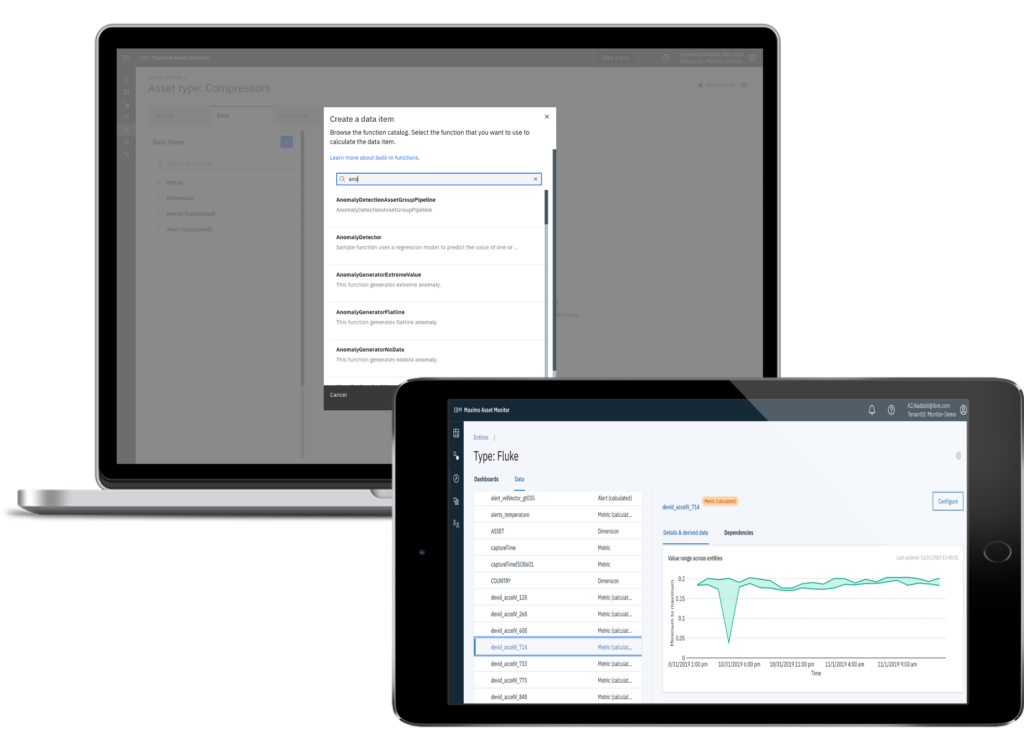
With just a few clicks, you choose in this step how your various data flows should be analyzed using AI. The predefined catalog of analysis functions makes it easy to create an analysis method that suits your data. You might be interested in identifying trends given a specific time interval, or perhaps anomalies of a certain nature are of interest, or both in combination. In the case of noise level, for example, it can be as simple as registering an anomaly when the noise level in dB passes the lower or upper limits of a determined range, but it can also be that a certain pattern is particularly concerning and should be registered as an anomaly using more advanced AI functionality. Maximo Monitor allows you to fine-tune the analysis of data to suit your equipment. In this step, you also configure alerts according to your preferences. Depending on your equipment, you might not want to draw attention from your workforce at the slightest anomaly, and you can, for example, set Maximo Monitor to alert only for persistent or consecutive anomalies.
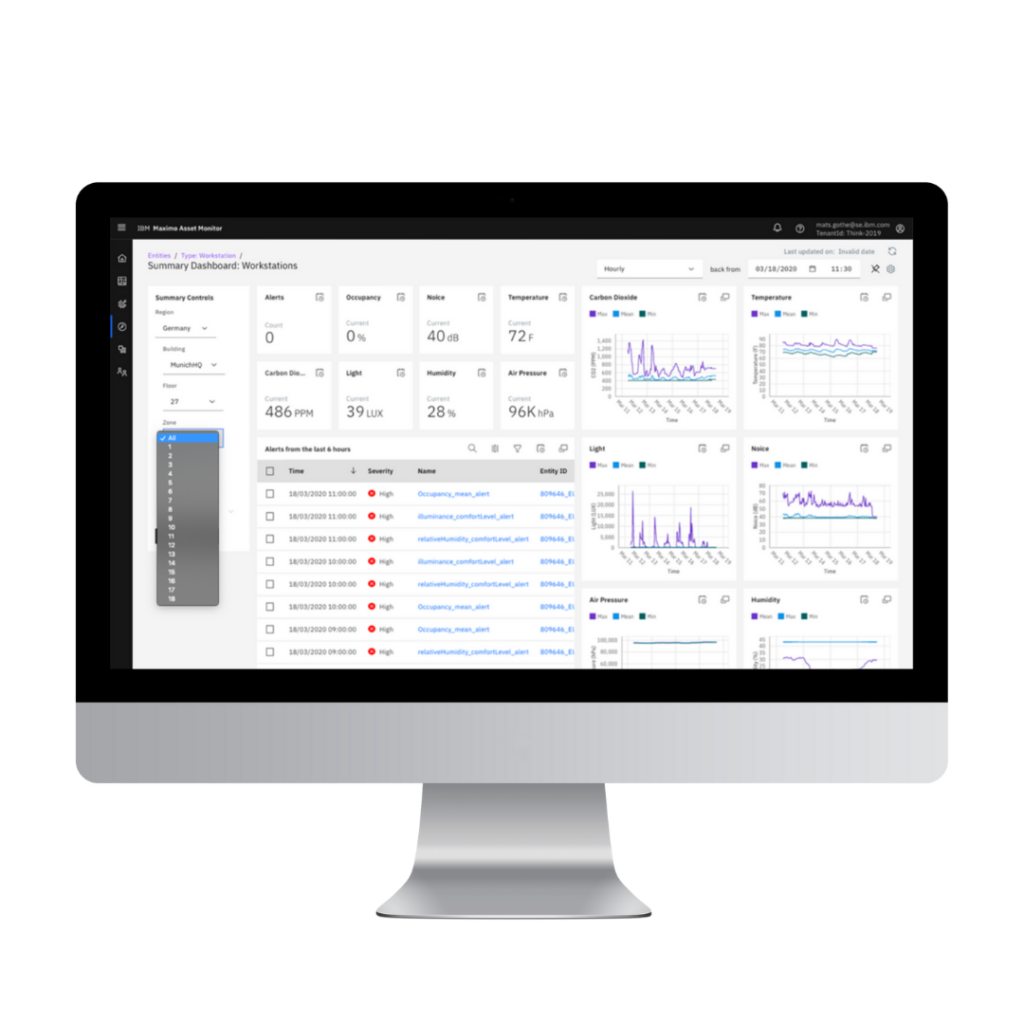
Visualize Results with Dashboards
The final step to fully utilize the features of Maximo Monitor involves visualizing the ongoing results of your analyses in live dashboards. You can arrange these according to your own needs to gain control over the health of your assets. Among the available widgets, you will find various types of graphs and summaries of registered alerts, whose rules you have previously defined. From the alert summary, you can easily create service requests for the relevant asset in Maximo Manage. Get started with Maximo Monitor and let your data work for you.
